Where New Zealand is projected to be short of teachers in 2026
New Zealand’s teacher shortage looks very different depending on where—and at which school level—you teach. The Ministry of Education’s 2025 planning report, published in February 2026, projects a national shortfall of 710 secondary teachers in 2026 under its medium supply scenario, alongside a projected primary-teacher surplus. Those national totals conceal substantial regional differences.
Two sectors, two different maps
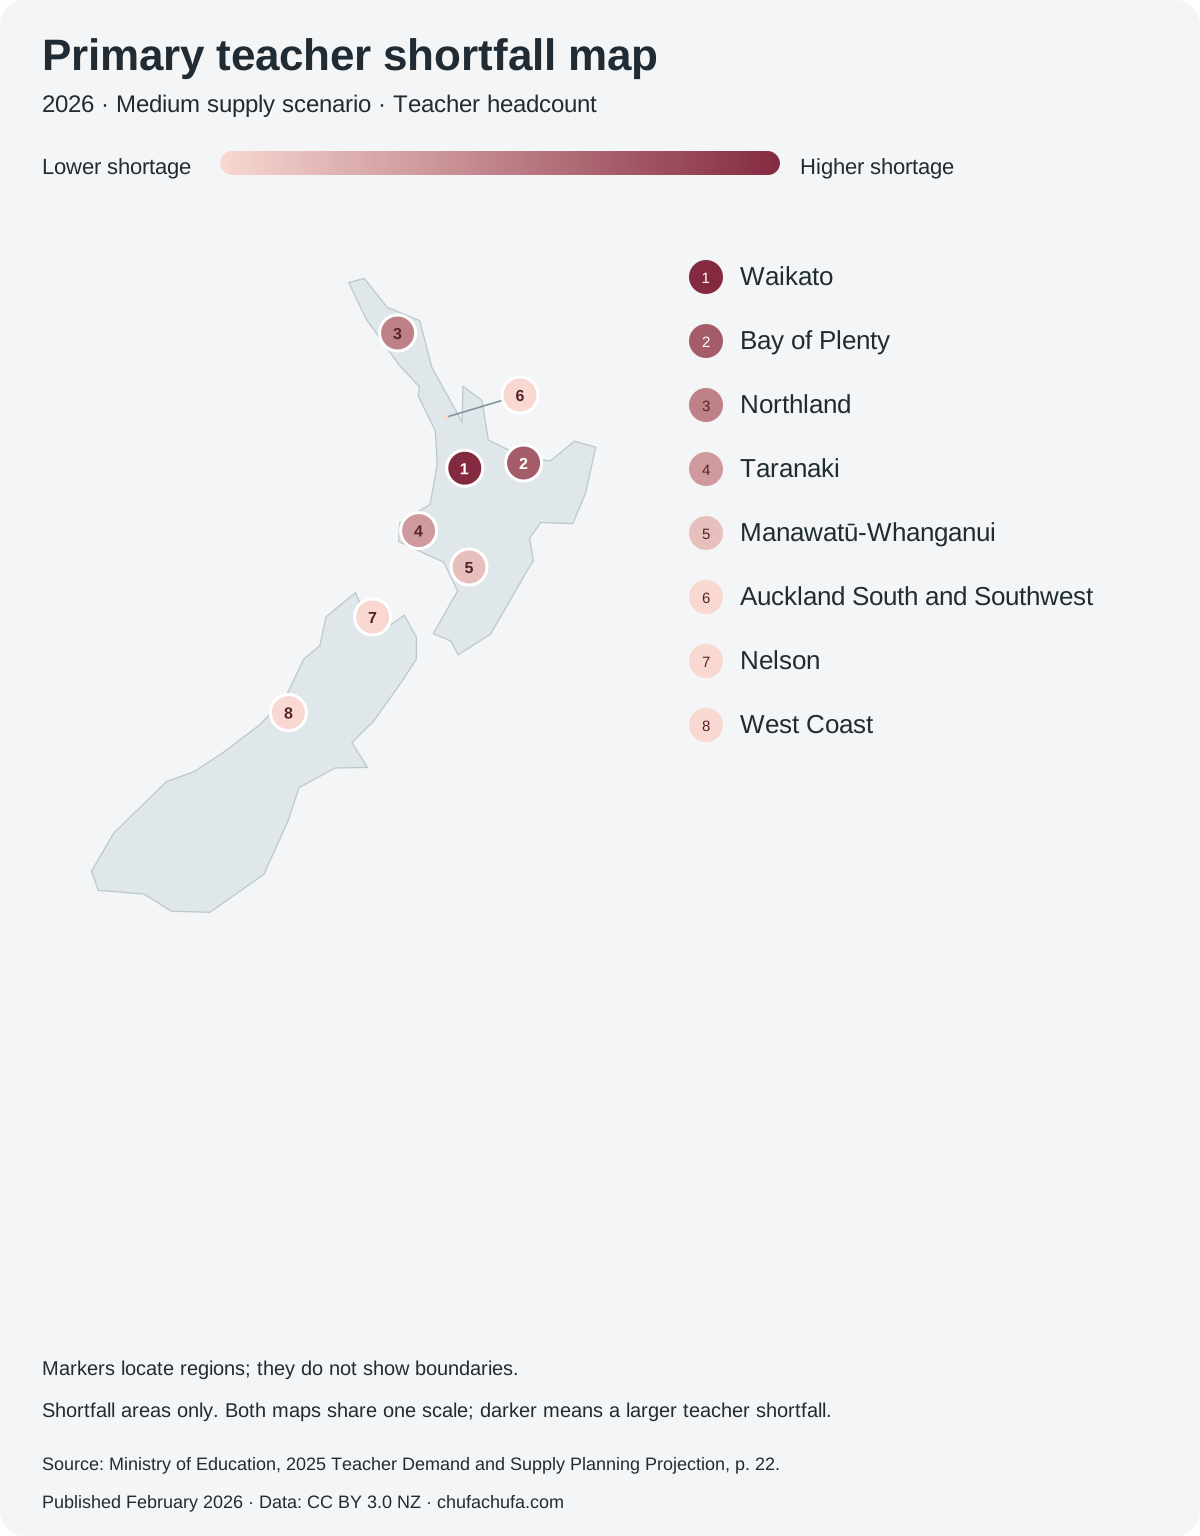
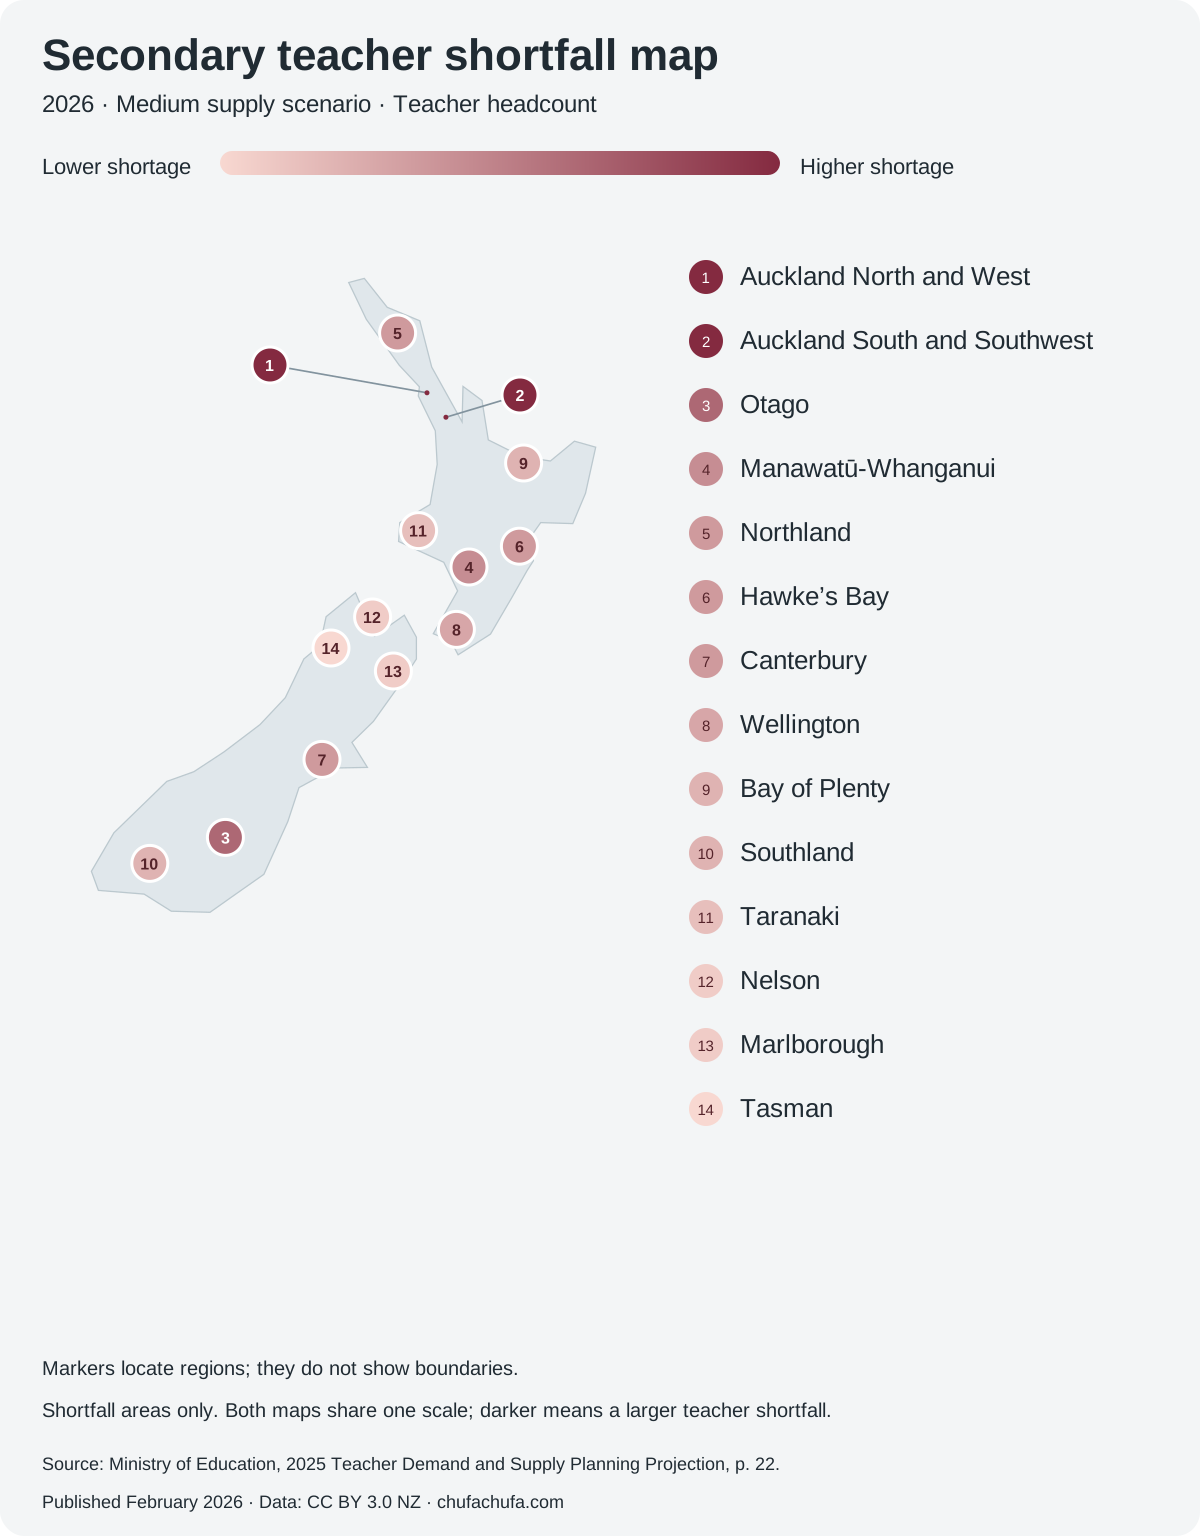
2026 projections, not a live vacancy count. Only areas with projected shortfalls are shown. Both maps use the same colour scale: darker shades mean a larger shortfall by teacher headcount. Near-zero shortfalls use the lightest shade. Numbered markers indicate regional locations rather than boundaries; Auckland’s dots are spaced apart, with lines pointing to representative locations in each area.
View figures for areas with shortfalls
| Region | Supply gap |
|---|---|
| Waikato | -140 |
| Bay of Plenty | -100 |
| Northland | -70 |
| Taranaki | -50 |
| Manawatū-Whanganui | -20 |
| Auckland South and Southwest | -10 to 0 |
| Nelson | -10 to 0 |
| West Coast | -10 to 0 |
| Region | Supply gap |
|---|---|
| Auckland North and West | -140 |
| Auckland South and Southwest | -140 |
| Otago | -90 |
| Manawatū-Whanganui | -60 |
| Northland | -50 |
| Hawke’s Bay | -50 |
| Canterbury | -50 |
| Wellington | -40 |
| Bay of Plenty | -30 |
| Southland | -30 |
| Taranaki | -20 |
| Nelson | -10 |
| Tasman | -10 to 0 |
| Marlborough | -10 |
What changed
For primary teachers, Waikato has the largest projected shortfall by headcount (140), followed by Bay of Plenty (100), Northland (70) and Taranaki (50). Manawatū-Whanganui also has a shortfall of 20. Auckland South and Southwest, Nelson and West Coast each have a small negative range of −10 to 0.
For secondary teachers, Auckland North and West and Auckland South and Southwest each face a projected shortfall of 140, followed by Otago at 90. The table records negative point estimates in 13 regions, plus a small negative range in Tasman. Auckland Central and East has a projected surplus, illustrating why Auckland should not be treated as one uniform market.
What this means
The maps show teacher headcounts, not full-time-equivalent posts or advertised vacancies. The model covers permanent and fixed-term teachers in state and state-integrated schools, including teachers with a Limited Authority to Teach; day-relief teachers are excluded.
A regional surplus does not mean every school can recruit easily. The report identifies subject pressures in science, technology, mathematics and te reo Māori, alongside challenges in Māori-medium and Kaupapa Māori settings. A teacher surplus in one subject cannot simply fill a shortage in another.
Related routes
Use this map to shortlist regions, then check individual schools and subject-specific vacancies. The forecast is not a job offer or evidence of eligibility for registration or immigration.
Source and method: Ministry of Education, 2025 Teacher Demand and Supply Planning Projection (February 2026), national tables on pages 10 and 12, regional discussion on pages 16–18, and Annex 1 on page 22. This article uses the 2026 medium scenario throughout. Figures are rounded; small shortfall ranges of −10 to 0 are retained rather than converted into exact counts. The maps and table are an adaptation of the Ministry’s data under CC BY 3.0 New Zealand.
Also look at similar visas from these countries
Higher rating for quality of life
More accessible countries
More affordable countries
Open this story in the chufachufa app · All news · City guides · Visa routes